Google analytics and online reporting
Friday 23rd September 2016
Monitoring and analyzing your website usage is extremely important. Regardless of the size of your business you should always be looking to gain deeper insights in to your audience, how they are arriving at your website (acquisition), what they do when they arrive (behavior) and ways of increasing levels of interaction and communication (conversions). By looking at these metrics you can learn a lot about what your website visitors are looking for and how you can help them find it.
In-Page Analytics
A tool that enables you to identify what your visitors are doing on each of your web pages. It allows you to see the areas of content they are attracted to and those that aren’t receiving much traffic. This helps optimise the user experience and improve conversion rates. To access this information, head to google analytics and click ‘Behaviour’ then ‘In-Page Analytics’. You will be able to see what content your visitors are most interested in which can be used to help optimise the layout of your website.
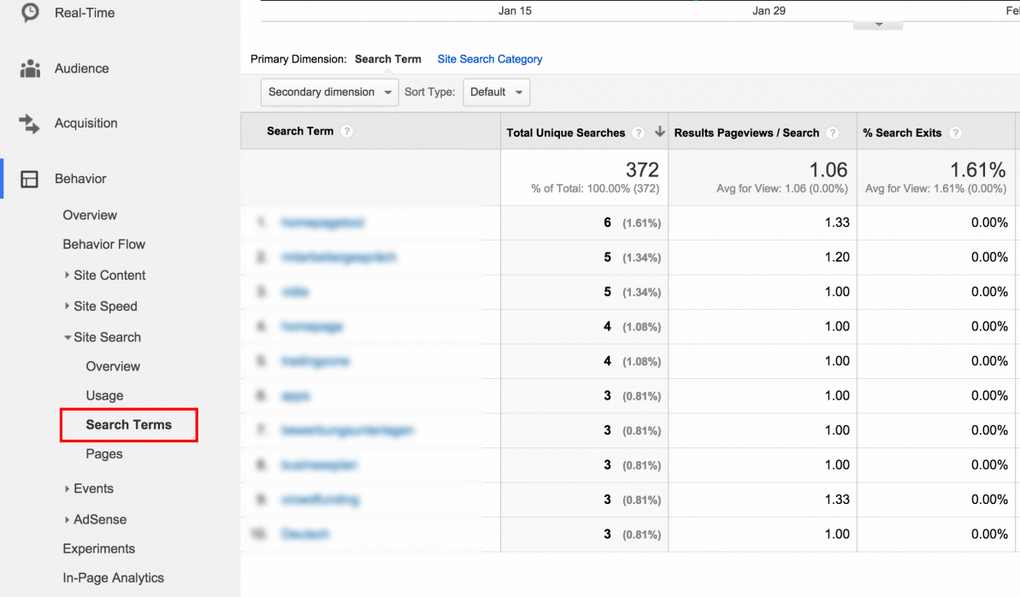
View Site Search Analytics
Visitors who use the search box on a website are much more likely to convert, compared to those that don’t. The reason for this is that they are more engaged and interested in your website.
You can look into the exact keywords customers have used in your website’s search bar- a great insight for when it comes to designing your SEO strategy. These keywords can help to optimise the pages on your website to allow customers to find what they are looking for much more easily. They also identify areas you might not have any information on that can be added to increase conversions.
Events Reporting
Another feature of Google Analytics is event tracking, a non-page view approach to tracking your website’s activity. A value can be set for the event, which will give you the opportunity to measure how beneficial the actions have been. The events reporting tool also allows you to look into your sites searches and find missing content.
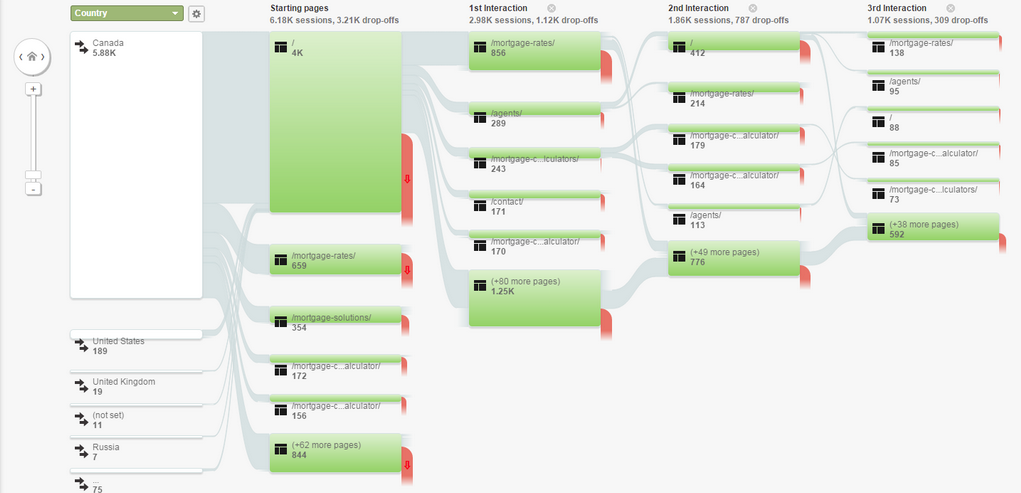
Visitor Flow Charts
A great way to analyse user journeys is through Google Analytics visitor flow charts. The starting point is where a user has entered your website. Following on from this is the first block showing their landing page. The blue lines show the chain they followed when moving on to other pages. This is a really great tool for mapping out the typical user journey of your website.
Custom Reports and Dashboards
Google Analytics allows users to create custom reports so they can quickly access the most useful data about their website. The Custom Dashboards give users insights into how each property is performing. It does this by showing a summary of each report as widgets but on a single page. This is so correlations between data can be easily seen and identified. Like custom reports, specific metrics and dimensions in your widgets can be used, as well as using a mix of both historical and real time data.
Google analytics can provide any website with valuable insights that can help uncover opportunities. Knowing what content visitors are looking for and how they expect to find it allows you to offer an enhanced user experience which has potential to generate better results.